User Interface
UI/HMI – Software performances:
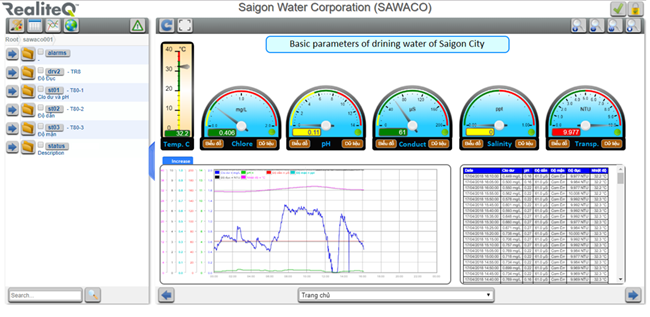
RealiteQ’s HTML5 WEB UI operates on any modern browser running on a PC, Tablet
or Smart-Phone. The UI comprises dynamic graphic screens with real time displays,
alarms and historical data. Features tools include system configurators, Screen-
Builders, alarm editors, report and trend editors. Each user can personalize screens, Dashboard & reports to his needs.
Other capabilities:
· Browser-based.
· Screens & Dashboards.
· Build in screen/graphics editor (customization).
· Nodes list management.
· Geographic presentation.
· Report & trends.
· Full alarm management.Any languageGeographic presentation. Data sharing among sites.
Reports & Trends:
- It is now possible to select freely each column (in table) and pen (in trends) by the user.
- It is now possible to display inside a graphical screen several trends and table for smarter dashboards.
- In graphical screens it is possible to configure a dedicated time frame (day, week, month, year) for each one of the trends/tables presented.
BI (Business intelligence) & Data analytics
- BI functions that use aggregated data and present, as part of the real time system, the calculated results to be used in dashboards and all parts of the system. Some functions are for Alarms (such as average alarm duration, amount of active alarms, amount of historical alarms over period), some are for values (such as Max, Min, Average) and more.
Alarms handling:
- It is possible to define escalation mode (unlimited escalation steps)
- It is possible to configure “Nagging” for alarms (may also combine Nagging + escalation(
- It is possible to monitor open and duration of alarms as part of the BI part (see below).

Maunal downloads:


